The use of artificial intelligence (AI) in the investment sector is proving to be a significant disruptor, catalyzing the connection between the different players and delivering a more vivid picture of the future risk and opportunities across all different market segments. Real estate investments are not an exception. In this article, we’ll showcase the ability of AI to improve the quality of the potential investment’s future performance, with a specific example from the real estate segment.
The lack of transparency, efficiency, and sustainability in real estate today is more a rule than an exception. One might imagine that the increase in available data would lead to greater transparency and more efficient markets, but the opposite seems to be the case as increased access to massive amounts of data has made assessing real estate assets much more complex.
In this context, an augmented intelligence approach around the data will be increasingly more critical for asset managers, investors, and real estate developers to ensure a better understanding of the real estate assets and take better decisions aimed at optimizing both the Net Asset Value and the Net Operating Income. Yet, in the digital transformation era, the pricing and assessment of real estate assets is more difficult than described by brokers’ presentations, valuation reports, and traditional analytical approaches like hedonic models.
Previously, we demonstrated how DataRobot AI Platform allows investors, asset managers, and real estate developers to successfully overcome most of the existing challenges regarding the real estate investment business.
In this article, we’ll first take a closer look at the concept of Real Estate Data Intelligence and the potential of AI to become a game changer in this niche. We’ll then empirically test this assumption based on an example of real estate asset assessment. For this purpose, we will showcase an end-to-end, data-driven approach to price predictions of real estate assets through the DataRobot AI Platform.
Real Estate Data Intelligence
Today, the most critical ‘raw material’ driving the real estate market is data. Many real estate players have long made decisions based on traditional data to answer the question of the quality of asset’s assessment and an investment’s location within a city. This usually involved gathering market and property information, socio-economic data about a city on a zip code level and information regarding access to amenities (e.g., parks and restaurants), and transportation networks. The traditional assessment approach also considered factors such as market intuition and experience.
Although the amount of data has been growing exponentially—hosting new variables that may make it possible to have a better picture of location’s future risks and opportunities—the intelligence needed to process all this data and use it to benefit real estate decisions is still relatively nascent.
Let’s assume that investors, asset managers, and real estate developers want to evaluate an asset’s performance. While the impact of proximity might be intuitive, home prices and rents are not just driven by having nearby amenities like top-tier restaurants and educational facilities. Instead, they are driven by the access to the appropriate quantity, mix and quality of neighborhood features. More is not always better. Nonlinear relationships between prices and amenities seem to be the rule rather than the exception across cities worldwide.
Also, the intersection of proximity and density to amenities varies among neighborhoods and cities. This sweet spot has been obscured by a growing mass of new available multimodal data (geospatial, time series, text, and image data) that is increasingly difficult to tame, such as building energy consumption spatially related to other assets in the same zip code, number of permits in the last 3 months issued to build swimming pools, Google reviews for nearby businesses, and asset’s exterior images captured by Google.
What would happen if an automated intelligence machine approach could process and understand all this increasingly massive multimodal data through the lens of a real estate player and use it to obtain quick actionable insights?
For example, just to name the business of asset managers is generally dependent on these (but not limited to) four fundamentals:
- Accurately estimating the current asset’s price and rent
- Estimating the growth potential of a city and neighborhood
- Automating and optimizing their investment strategy
- Selling asset portfolios at a price that maximizes returns while minimizing time to market
However, they are also simultaneously dealing with several challenges that may block them to obtain valuable and actionable business insights. As discussed in the previous article, these challenges may include:
- Automating the data preprocessing workflow of complex and fragmented data
- Monitoring models in production and continuously learning in an automated way, so being prepared for real estate market shifts or unexpected events.
Yet, when assessing property’s value and the quality of investment’s location other key specific challenges arise, including:
- Handling multimodal data such as images, geospatial and text
- Building analytical approaches to assess asset’s price and rent that comply with regulations
- Treating customers fairly and avoiding bias in the analytical approach to estimate property’s value.
From this viewpoint, one may sustain that if an automated intelligence machine approach can successfully handle all these challenges while matching the real estate players’ business expectations, this would become a real game changer for the industry as it will bring intensive light on the discussion about real estate data intelligence: efficiency, transparency, location knowledge, and actionable insights.
Predicting the Real Estate Asset’s Price Using DataRobot
Processing Multimodal Datasets
Datarobot enables users to easily combine multiple datasets into a single training dataset for AI modeling. DataRobot also processes nearly every type of data, such as satellite and street imagery of real estate properties using DataRobot Visual AI, the latitude and longitude of properties and nearby city’s points of interest using DataRobot Location AI, tweets, and reviews with geotagged locations using DataRobot Text AI. Recent historical trends in neighborhoods can also be seen with DataRobot Feature Discovery and a variety of other details such as solar orientation, construction year, and energy performance.
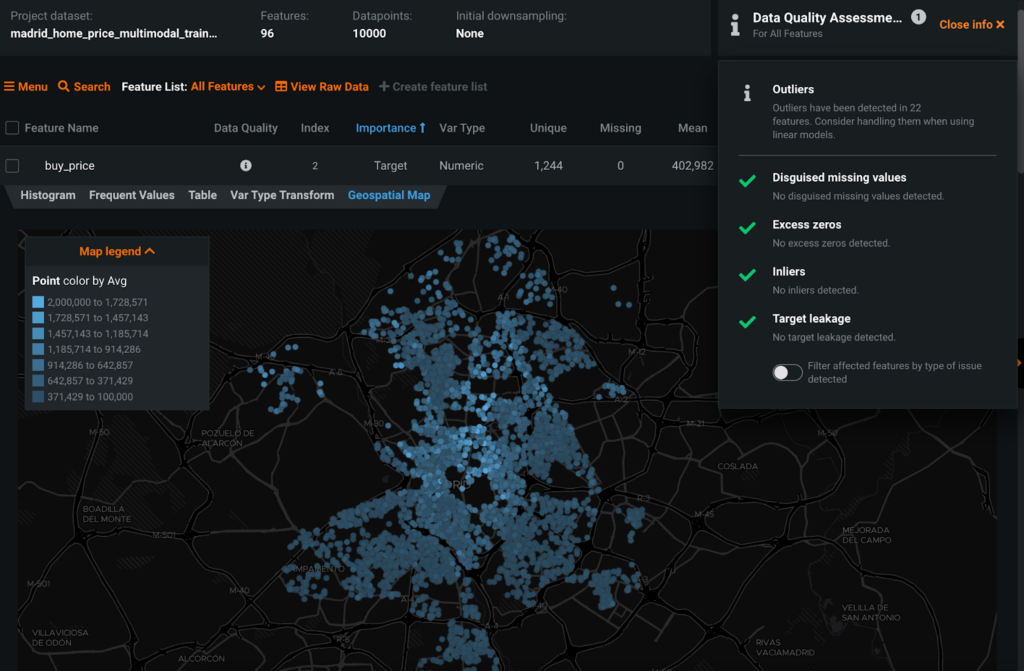
DataRobot combines these datasets and data types into one training dataset used to build machine learning models. In this educated example, the aim is to predict home prices at the property level in the city of Madrid and the training dataset contains 5 different data types (numerical, categorical, text, location, and images) and +90 variables that are related to these 5 different groups:
- Market performance
- Property performance
- Property features
- Neighborhood attributes
- City’s pulse (quality and density of the points of interest)
The great thing about DataRobot Explainable AI is that it spans the entire platform. You can understand the data and model’s behavior at any time. Once you use a training dataset, and after the Exploratory Data Analysis, DataRobot flags any data quality issues and, if significant issues are spotlighted, will automatically handle them in the modeling stage.
Rapid Modeling with DataRobot AutoML
DataRobot AutoML rapidly builds and benchmarks hundreds of modeling approaches using customized model blueprints. Using built-in automation workflows, either through the no-code Graphical User Interface (GUI) or the code-centric DataRobot for data scientists, both data scientists and non-data scientists—such as asset managers and investment analysts—can build, evaluate, understand, explain, and deploy their own models.
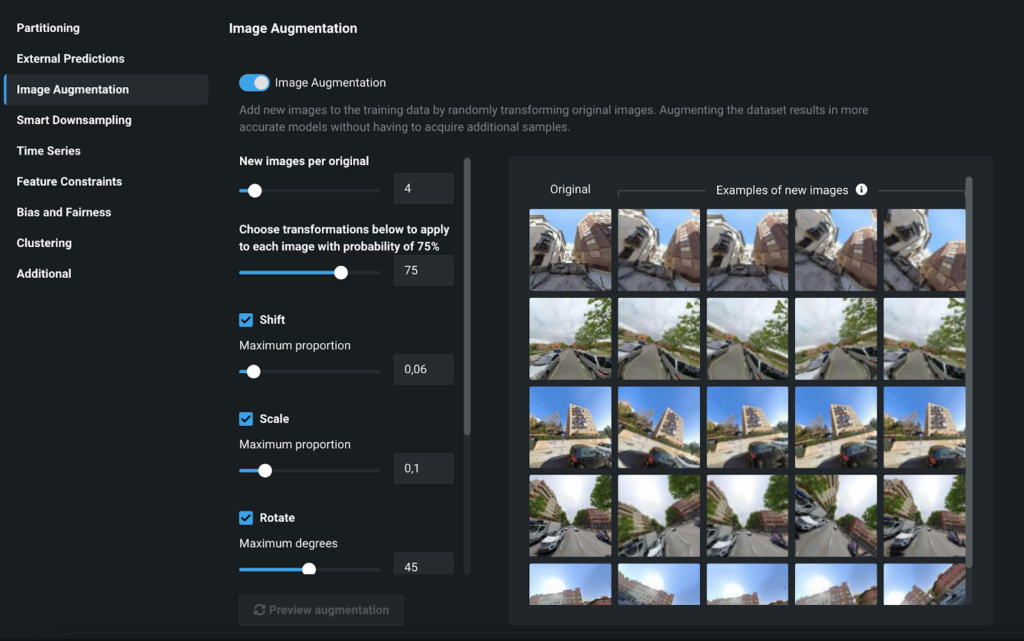
Enabling image augmentation generated the best results for predicting house prices across the city of Madrid. DataRobot automatically determines the best configuration for the dataset. However, we can customize it further. As the figure below shows, you can customize the image augmentation flips, rotating, and scaling images to increase the number of observations for each object in the training dataset aimed to create high performing computer vision models.
DataRobot starts modeling after we enable some additional settings, like including advanced ensembling and blueprints, as well as search for interactions to leverage relationships across multiple variables, potentially yielding a better model accuracy and feature constraints to integrate the real estate market expertise and knowledge.
In less than an hour, DataRobot produced a house-price multimodal model that correctly predicted house prices across space and performed especially well at predicting which 10% of properties had the highest home prices. By using this model, all accuracy metrics would also comply with national valuation regulations—as defined by the Bank of Spain. For example, the model produced a RMSLE (Root Mean Squared Logarithmic Error) Cross Validation of 0.0825 and a MAPE (Mean Absolute Percentage Error) Cross Validation of 6.215. This would entail a roughly +/-€24,520 price difference on average, compared to the true price, using MAE (Mean Absolute Error) Cross Validation.
Understand & Explain Models with DataRobot Trusted AI
DataRobot AI Platform tries to bridge the gap between model development and business decisions while maximizing transparency at every step of the ML & AI lifecycle. As discussed earlier, this is highly critical for all real estate players, including asset managers, as they need to build analytics approaches to assess asset sale and rent prices without any black-box patterns in the decision-making, delivering transparency in how predictions are generated.
So, let’s look under the hood at some of DataRobot Explainable AI functionality that can be more relevant for real estate players, allowing them to understand the behavior of models, inspire confidence in their results, and easily translate these modeling results into actionable business insights and great outcomes.
Accuracy over Space
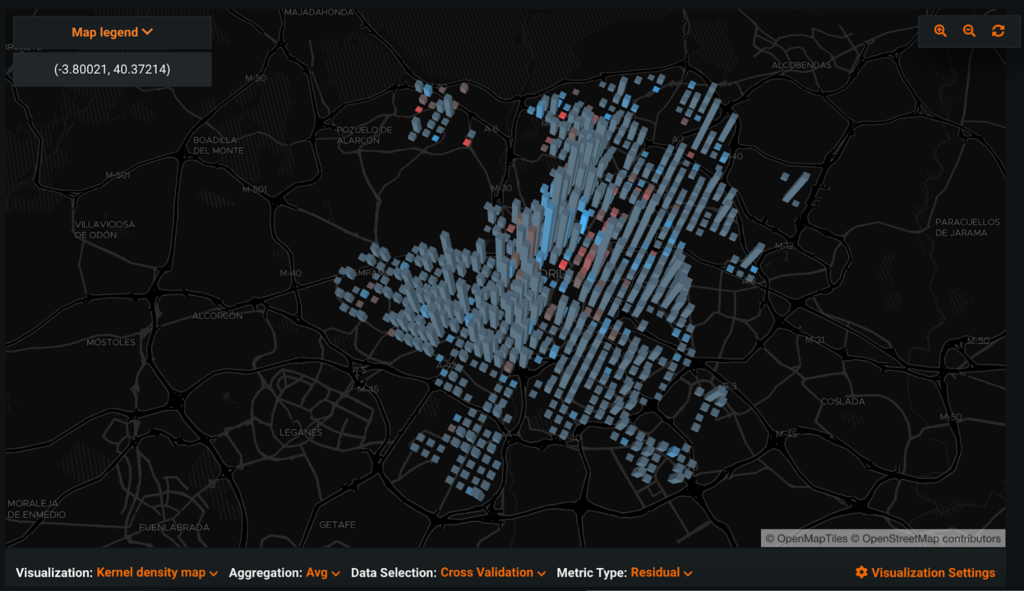
Location AI and in particular, with the Accuracy Over Space explainability tool, we can better understand how the house-price multimodal model, developed in DataRobot, is behaving at the local level. Model accuracy can vary greatly across geographic locations—but, thanks to this explainability tool—asset managers and investment analysts can quickly and exactly identify where, in terms of location, the model is accurate and where it is not.
In the figure below, we see a good spatial fit of our machine learning model with most locations where the average residual is low and very few locations where the model is either over-predicting (see light blue bars) or under-predicting (see light red bars), e.g., properties located near Pozuelo de Alarcón.
Global Explainability
One of the first things that real estate players usually want to understand better is the behavior of the model as a whole across all data. This is where the interpretability capabilities of DataRobot, like Feature Impact, Feature Effects, and Activation Maps—among others—come into play.
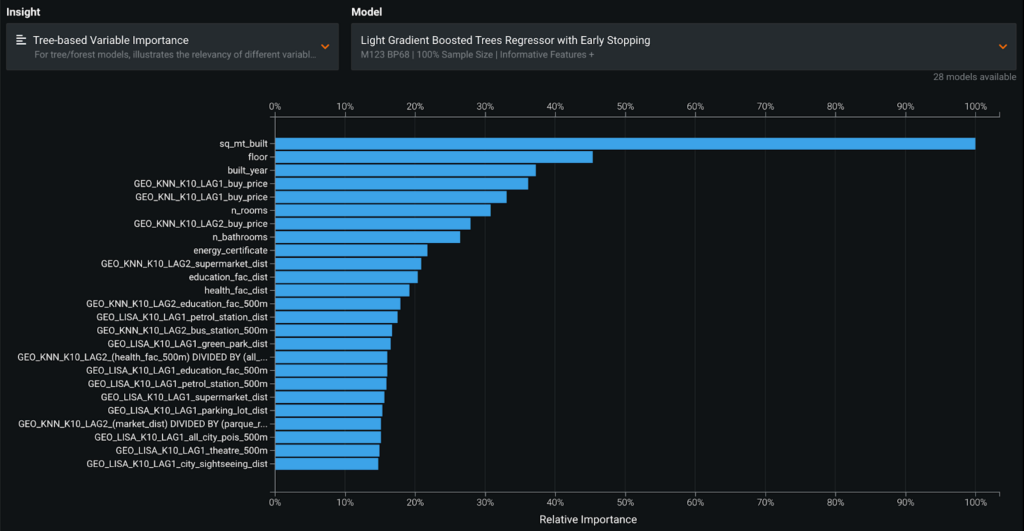
Feature Impact shows the most important features of the model’s predictions. DataRobot can use either Permutation Based Importance or SHAP Importance to compute importance. It is worth mentioning here that when spatial structure is present in the training dataset, DataRobot Location AI expands the traditional automated feature engineering to fully accommodate new geospatial variables for modeling that improves model performance.
In the next figure we see that among the top-25 most important features in the most accurate house-price multimodal model, the city’s amenities and location-based variables are the most representative. For example, there is a significant impact from the average price (GEO_KNN_K10_LAG1_buy_price) and the kernel density average price (GEO_KNL_K10_LAG1_buy_price) of the first ten nearest neighbors, as well as amenities variables like proximity to both educational and health facilities.
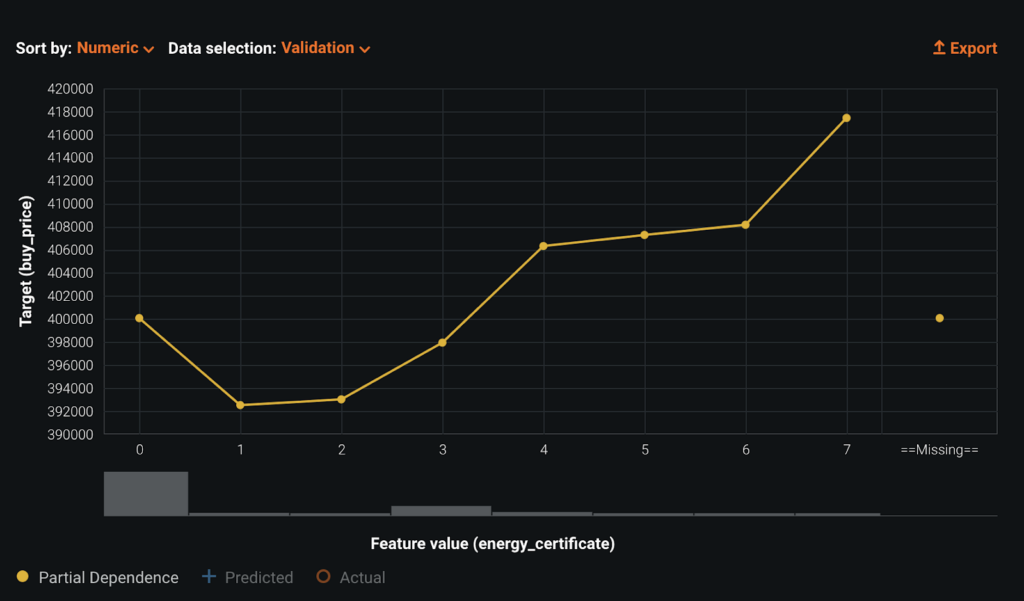
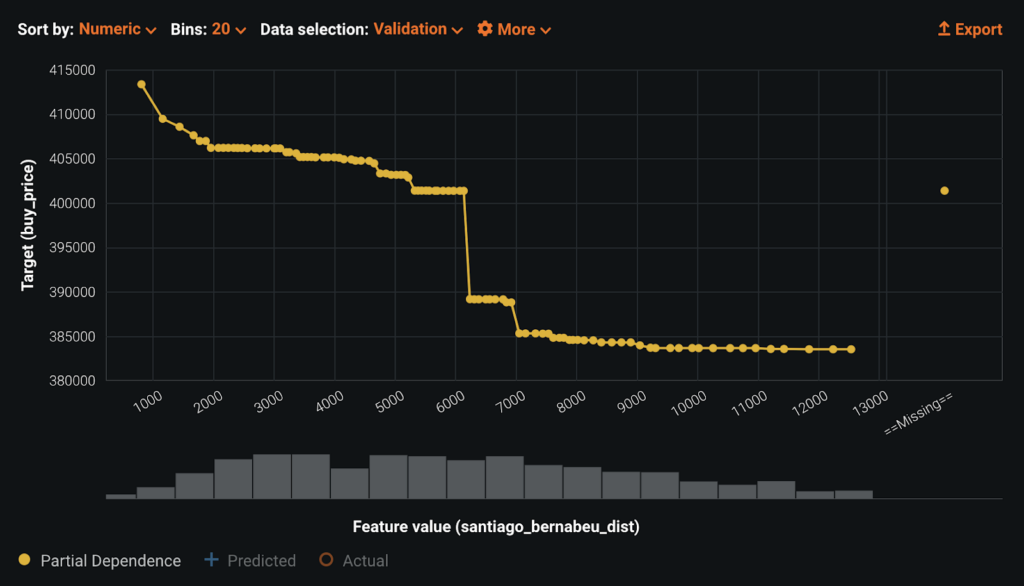
Once we know which features are most influential to the model’s decision making, real estate players can also be interested in addressing the question of how exactly do the features affect the model. This is exactly what you can address by using Feature Effects, which allows DataRobot users to see how different values of a variable affects the model’s predictions. The calculation is based on Partial Dependence.
Looking at the Feature Effects of our top model, we can see, for example, that greater energy performance and being located closer to Santiago Bernabéu Stadium (Real Madrid CF Stadium) lead to higher average predicted house prices. These two insights match a quick gut-check: e.g., Santiago Bernabéu Stadium exerts a home price distance-decay effect over its neighboring areas because it acts, coupled with Azca, as a major sub-center of economic, retail, and leisure activity in Madrid.
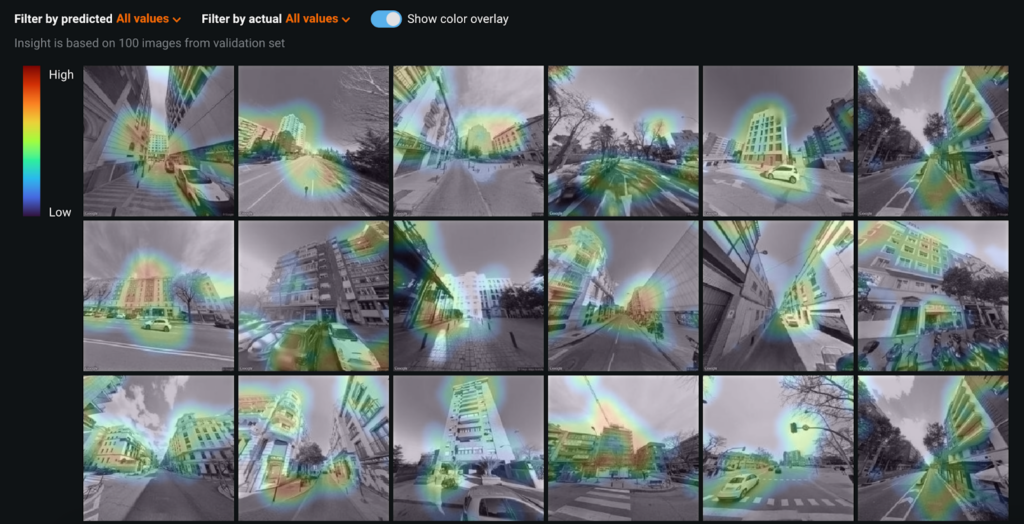
Because our training dataset is multimodal and contains imagery data of residential properties in Madrid, DataRobot used machine learning models that contain deep learning based image featurizers. Activation Maps allows DataRobot users to see which part of various images the machine learning model is using for making predictions. This can help real estate professionals determine if the machine learning model is learning the right information for the use case, does not contain undesired bias, and is not overfitting on spurious details.
Looking at the Activation Maps of our top model, we can observe that the model is generally focused on the exterior image of properties. Of course, DataRobot users can easily customize the image featurizer if necessary.
Local Explainability
After describing the overall model’s behavior, real estate players and, in particular, asset managers and real estate appraisers, would probably want to know why a model made an individual prediction. This is extremely valuable when you need to justify the decision an analytical model has made. Also, when you need to optimize the real estate product to develop in a specific location or the investment’s location decision within a city.
Let’s assume that, as a real estate developer, you would like to optimize the property’s price given a location in a city while minimizing time on market. Local Explainability will help them to identify the main property’s value contributors at the training time and subsequently running both what-if scenarios and mathematical optimization at the scoring time by changing actionable features, e.g., home size, number of rooms and bathrooms, and swimming pool construction.
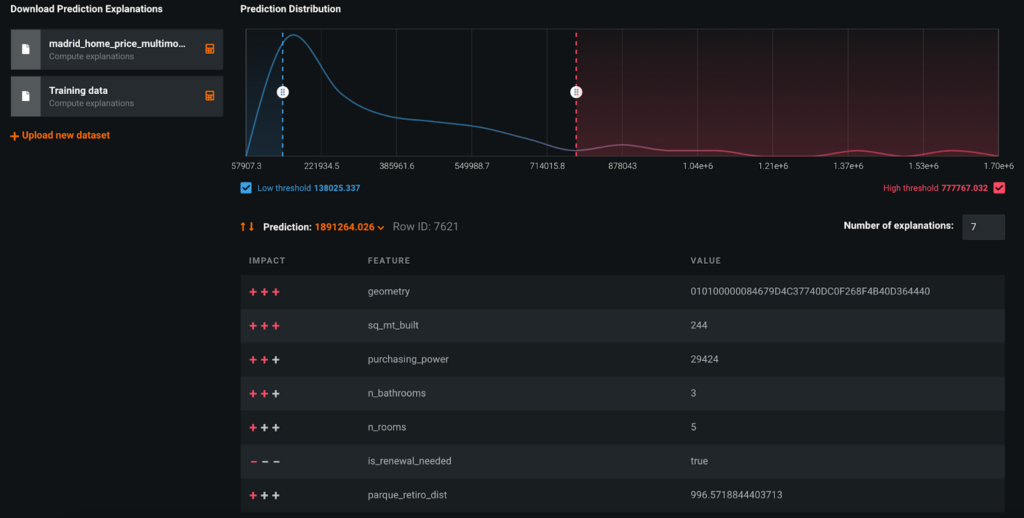
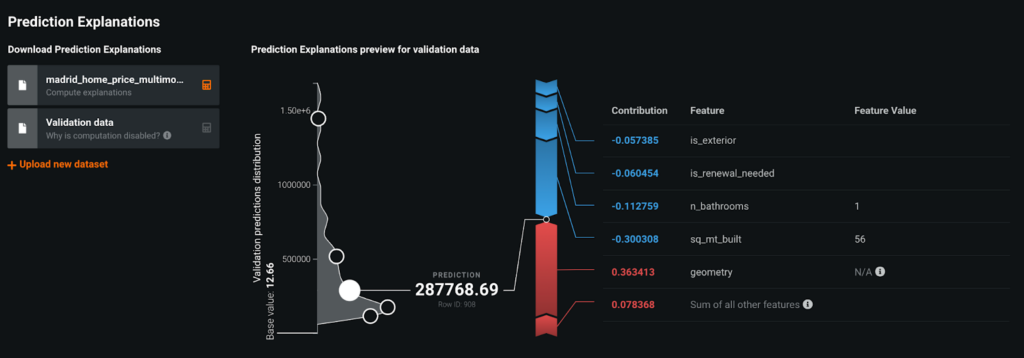
Local Explainability in DataRobot AI Platform is available through Prediction Explanations. This will tell real estate professionals which features and values contributed to an individual prediction—and their impact and how much they contributed. DataRobot can use either its own XEMP explanations or SHAP explanations. Both types of prediction explanations can be produced at training or scoring time.
Let’s have a closer look at both prediction explanations types. In the first figure below, using our most accurate house-price multimodal model, we are looking at the XEMP prediction explanation for row 7,621, which had a prediction of roughly €1,891,000 for home sales price. The specific spatial location of this property, including all related geospatial variables (e.g., the average number of educational facilities within 500 meters of the second ten nearest neighbors), and having 244 square meters, three bathrooms, and five rooms were the strongest contributors to this prediction. If we were to use SHAP explanations (see second figure below) that would produce actual numbers for each feature value, which add up to the total predicted property’s sale price.
Compliant-Ready AI
With regulations across various industries—and the real estate sector not being an exception—the pressure on real estate professional teams to deliver compliant-ready AI is greater than ever. This may be the case, for example, when asset managers or real estate servicers would like to assess the value of Non-Performing Loans (NPL) portfolios or appraisers when carrying out property’s valuations that comply with national regulations.
DataRobot Automated Compliance Documentation allows to create automated customizable reports based on each step of the machine learning model lifecycle with just a few clicks, thereby exponentially decreasing the time-to-deployment while ensuring transparency and effective model risk management.

Consume Results with DataRobot AI Applications
By bringing the recommended house-price multimodal model to DataRobot No Code AI Apps, real estate investors, asset managers, and developers can easily get intelligent AI Applications that automate the decision-making process of their business.
Within the AI App, real estate players can predict a real estate portfolio with thousands of assets and dig deeper into the reasons driving each prediction with a few clicks. They could also assess new locations for either investment or real estate development as well as building their own reporting dashboards. As their core business is based on the quality of asset’s assessment and an investment’s location, these AI Application’s examples would be especially valuable for asset managers, real estate services, valuation advisory firms, and real estate developers.
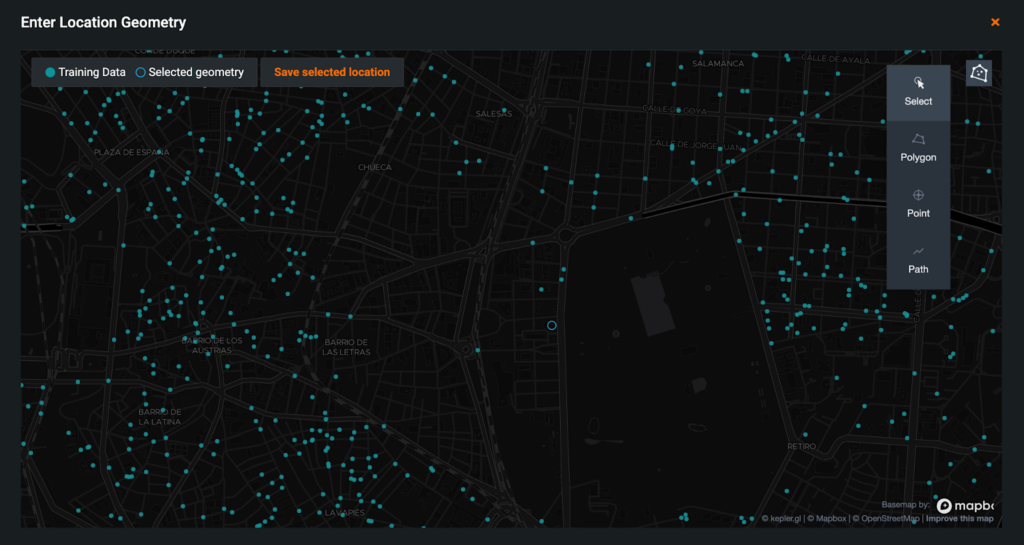
Interestingly, real estate players can also create their own scenarios based on their intuition and knowledge of the market to benchmark model outputs or build optimization models that either maximize or minimize their business outcomes. This also would help them to automate their investment and development strategy.
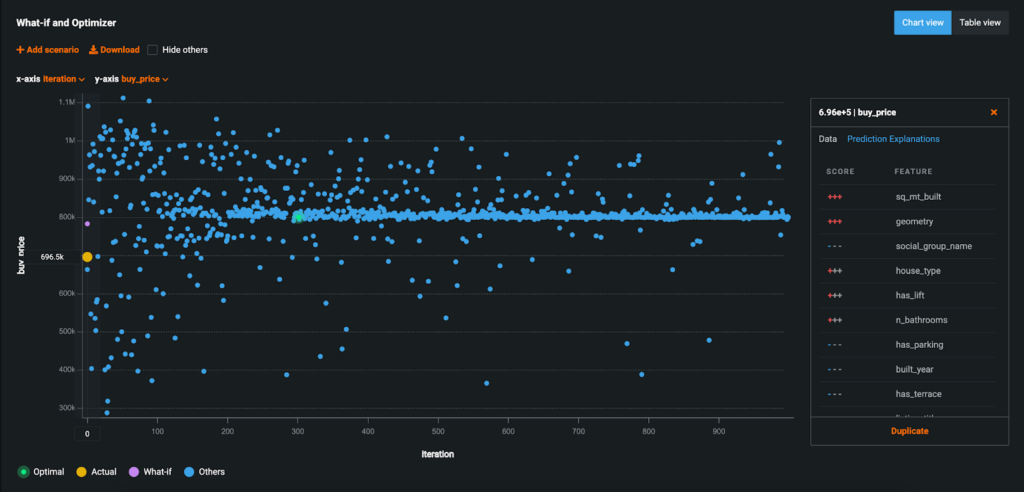
For example, asset managers will be able to sell asset portfolios at a price that maximizes returns while minimizing time to market. Likewise, real estate developers will be able to add new property price scenarios in different city locations by changing those actionable variables of their interest (e.g., home size, number of rooms) or building optimization models to maximize specific outcomes given certain business and market constraints (e.g., finding the best real estate product configuration to go to market with, given certain market price conditions). DataRobot will rapidly generate new insights aimed at helping real estate players to have full flexibility in testing different potential situations, scenarios, and optimal business outcomes as we can see below.
Last but not least, advanced analytics teams could also take advantage of the code-centric DataRobot functionality to build their own code-based applications. An example of code-based application is shown below. With the use of DataRobot API, advanced analytics teams in the real estate sector will be able to easily build AI applications in days that could do the following :
- Accurately predict the property’s price for a single asset or portfolio and a new location, while digging deeper into the reasons driving each prediction
- Estimate the future real estate market changes (e.g., prices and rents over the next year) and the growth potential of neighborhoods, districts, and cities
- Search and benchmark potential investment’s locations against real estate comparables
- Either maximize or minimize business outcomes through optimization models
- Automate their business strategy and decision-making process
Conclusions
We have just shown how AI can foster and scale Augmented Intelligence in investment and real estate by showing howDataRobot quickly produced a scalable and transparent end-to-end analytics approach to price predictions of real estate assets, while ensuring transparency and effective model risk management at every step of the ML & AI lifecycle.
DataRobot AI Platform is able to analyze a wide variety of patterns and make predictions based on the data that’s being analyzed. This is critical, as the real estate sector also has major business challenges that may require the use of other ML & AI approaches, like unsupervised learning (multimodal clustering and time series anomaly detection) to successfully address them. AI can also be applied to numerous other valuable use cases in the real estate sector and beyond the living real estate segment. Examples include both the office and retail market segments, as well as use cases related to investors, property managers, and commercial tenants. For instance, use cases related to optimizing the leasing portfolio management, like predicting which tenants will renew and which ones will leave the property when their lease expires—thereby helping to maintain a higher occupancy rate and foster a greater Net Operating Income (NOI).
About the author

Senior Customer-Facing Data Scientist, Team Lead at DataRobot
Jaume is a Senior Customer-Facing Data Scientist, Team Lead at DataRobot. He leverages the AI Cloud DataRobot platform to drive the adoption of AI and machine learning in major enterprises in EMEA, with a specific focus within the Banking, Insurance, and Utilities Industries. Prior to DataRobot, Jaume worked in a variety of data-centric roles in universities and major enterprises for more than 10 years, both as an individual contributor and director of data science. During this time period, he had the opportunity to build and lead many analytics products and data advisory services, with a special focus on the Real Estate sector, leveraging machine learning and applied statistics.
Jaume holds a PhD. in Statistics and Operations Research from UPC-BarcelonaTech and a PhD in Urban and Regional Economics from TU Delft and in his spare time enjoys traveling and playing chess.