Open source PyTorch runs tens of thousands of tests on multiple platforms and compilers to validate every change as our CI (Continuous Integration). We track stats on our CI system to power
- custom infrastructure, such as dynamically sharding test jobs across different machines
- developer-facing dashboards, see hud.pytorch.org, to track the greenness of every change
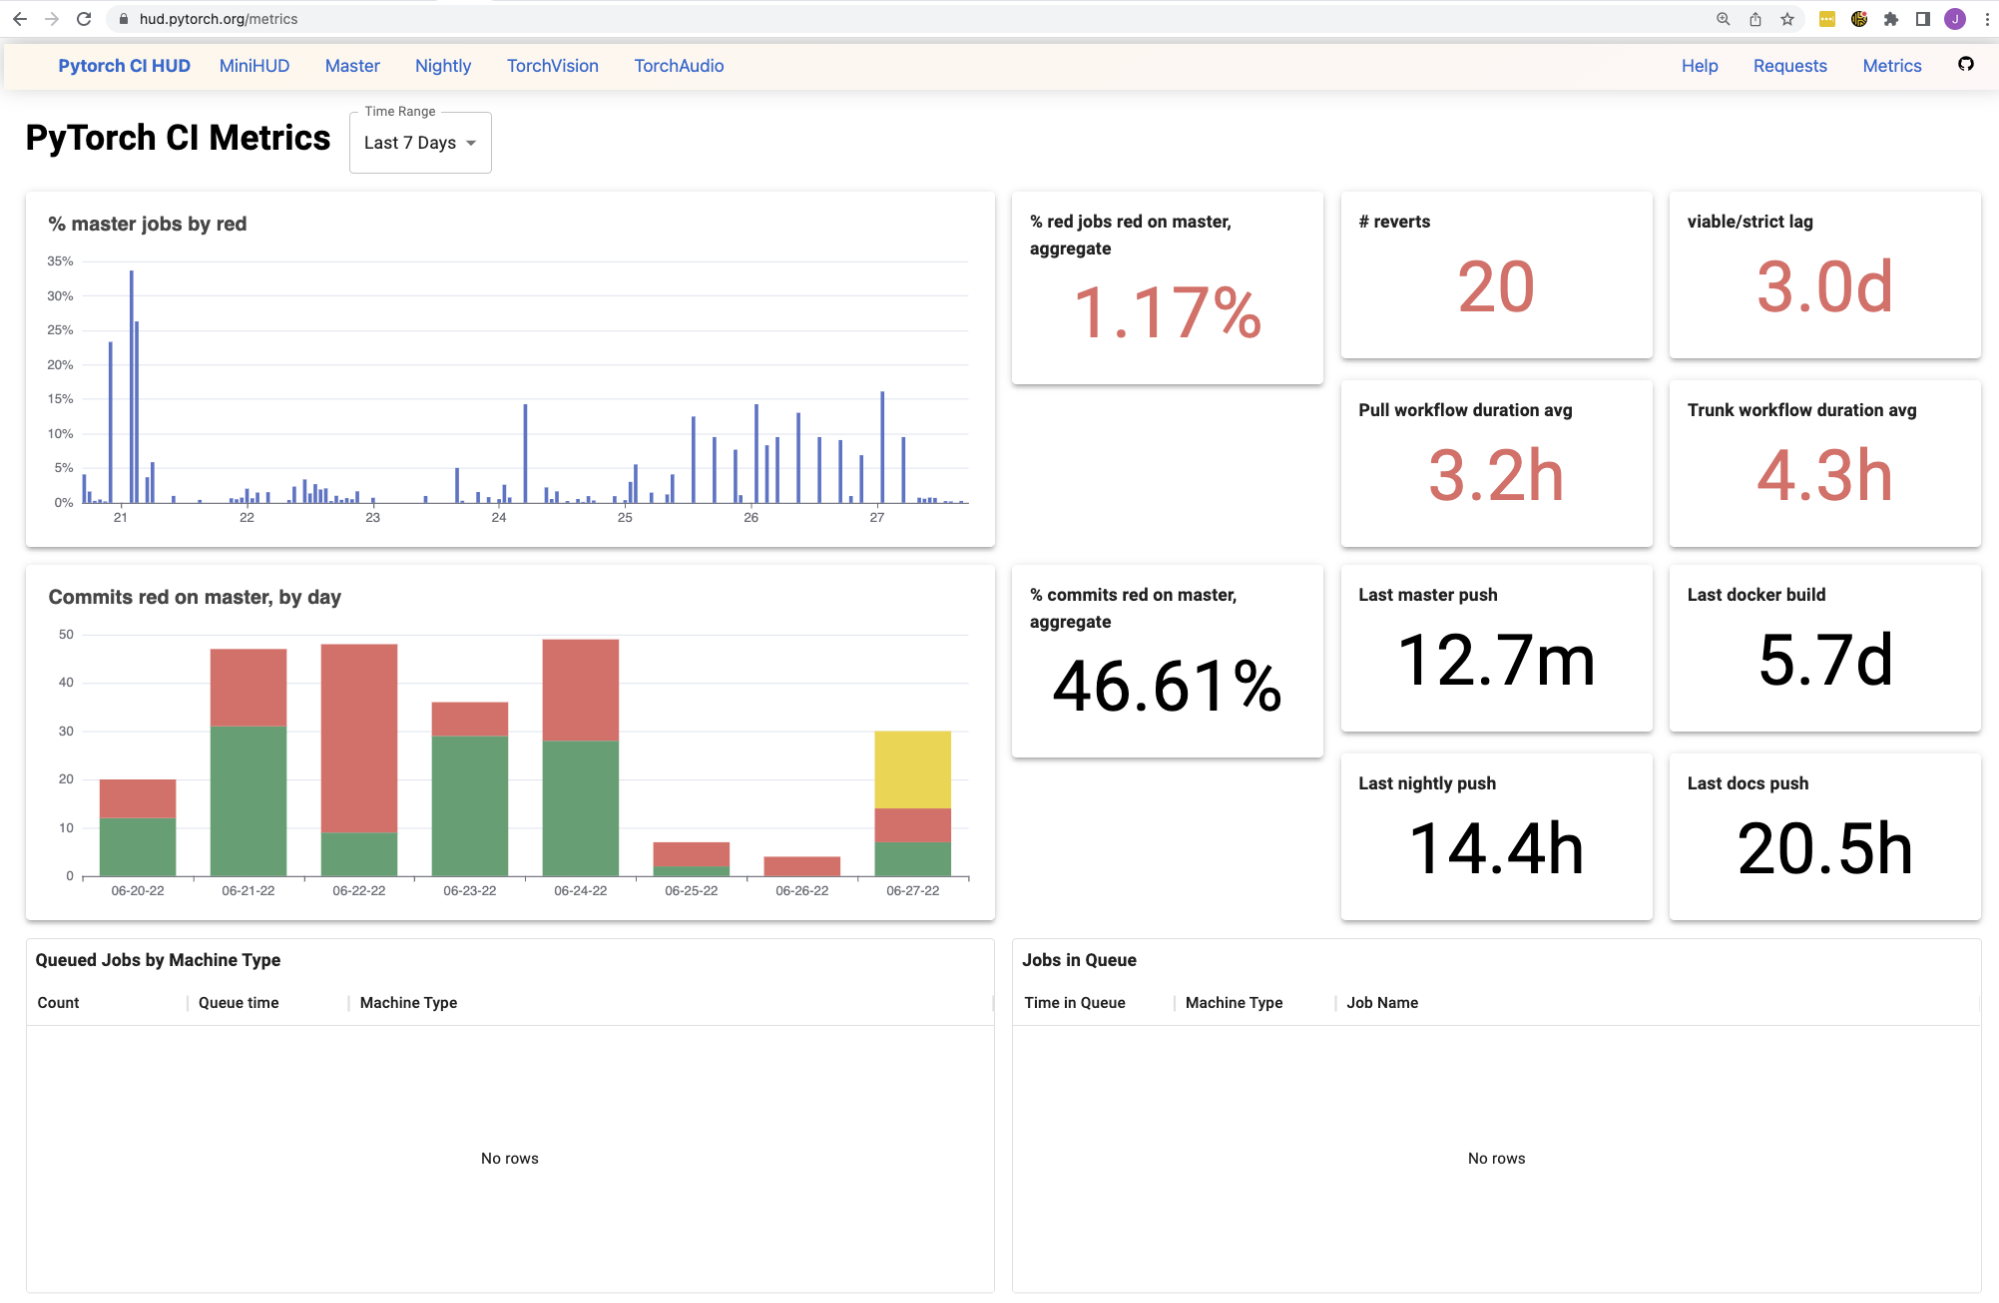
- metrics, see hud.pytorch.org/metrics, to track the health of our CI in terms of reliability and time-to-signal

Our requirements for a data backend
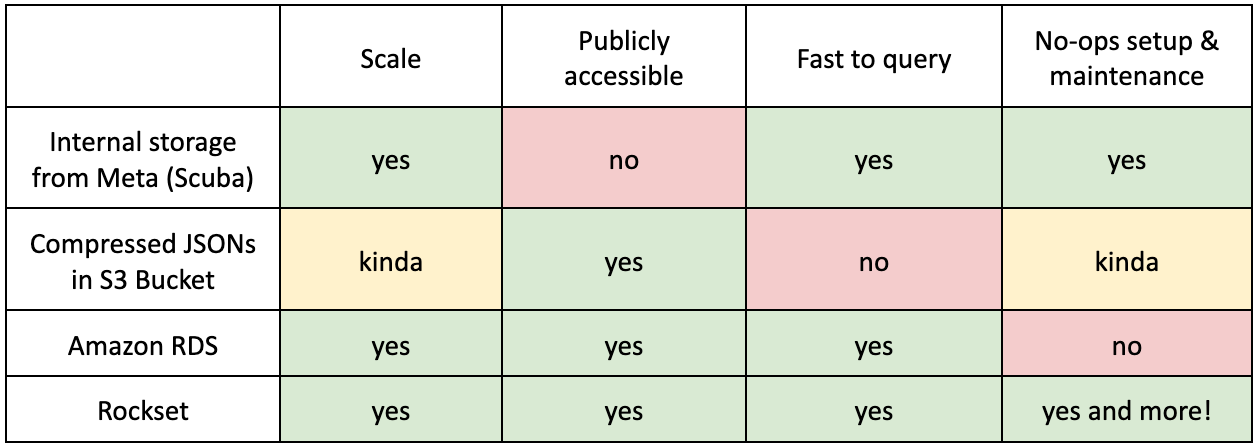
These CI stats and dashboards serve thousands of contributors, from companies such as Google, Microsoft and NVIDIA, providing them valuable information on PyTorch’s very complex test suite. Consequently, we needed a data backend with the following characteristics:
What did we use before Rockset?

Internal storage from Meta (Scuba)
TL;DR
- Pros: scalable + fast to query
- Con: not publicly accessible! We couldn’t expose our tools and dashboards to users even though the data we were hosting was not sensitive.
As many of us work at Meta, using an already-built, feature-full data backend was the solution, especially when there weren’t many PyTorch maintainers and definitely no dedicated Dev Infra team. With help from the Open Source team at Meta, we set up data pipelines for our many test cases and all the GitHub webhooks we could care about. Scuba allowed us to store whatever we pleased (since our scale is basically nothing compared to Facebook scale), interactively slice and dice the data in real time (no need to learn SQL!), and required minimal maintenance from us (since some other internal team was fighting its fires).
It sounds like a dream until you remember that PyTorch is an open source library! All the data we were collecting was not sensitive, yet we could not share it with the world because it was hosted internally. Our fine-grained dashboards were viewed internally only and the tools we wrote on top of this data could not be externalized.
For example, back in the old days, when we were attempting to track Windows “smoke tests”, or test cases that seem more likely to fail on Windows only (and not on any other platform), we wrote an internal query to represent the set. The idea was to run this smaller subset of tests on Windows jobs during development on pull requests, since Windows GPUs are expensive and we wanted to avoid running tests that wouldn’t give us as much signal. Since the query was internal but the results were used externally, we came up with the hacky solution of: Jane will just run the internal query once in a while and manually update the results externally. As you can imagine, it was prone to human error and inconsistencies as it was easy to make external changes (like renaming some jobs) and forget to update the internal query that only one engineer was looking at.
Compressed JSONs in an S3 bucket
TL;DR
- Pros: kind of scalable + publicly accessible
- Con: awful to query + not actually scalable!
One day in 2020, we decided that we were going to publicly report our test times for the purpose of tracking test history, reporting test time regressions, and automatic sharding. We went with S3, as it was fairly lightweight to write and read from it, but more importantly, it was publicly accessible!
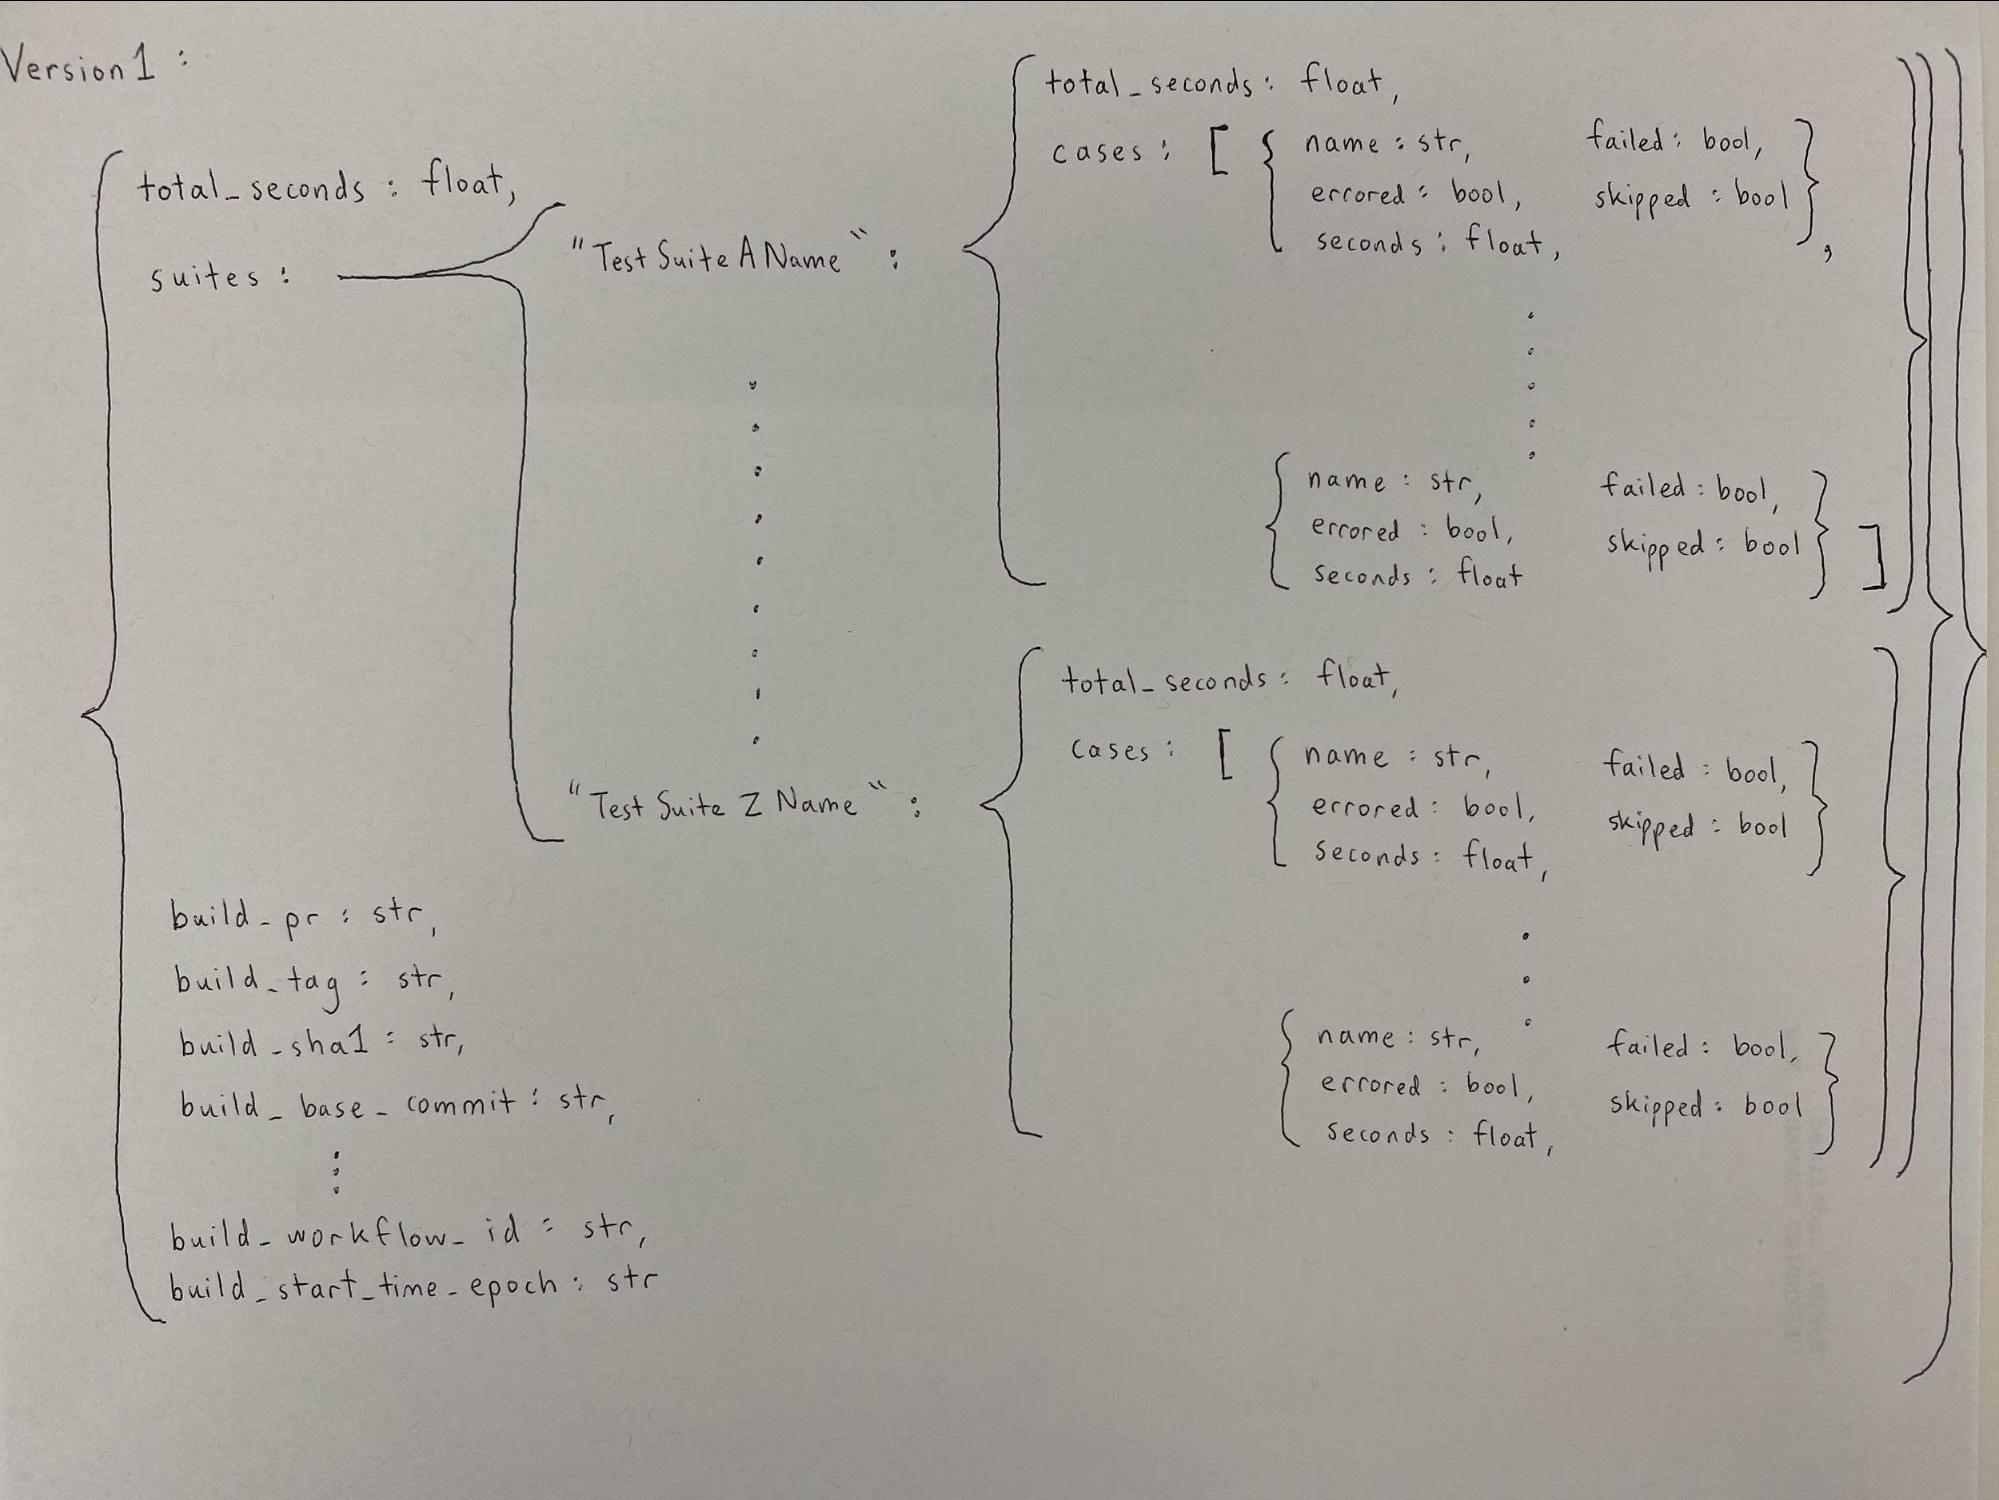
We dealt with the scalability problem early on. Since writing 10000 documents to S3 wasn’t (and still isn’t) an ideal option (it would be super slow), we had aggregated test stats into a JSON, then compressed the JSON, then submitted it to S3. When we needed to read the stats, we’d go in the reverse order and potentially do different aggregations for our various tools.
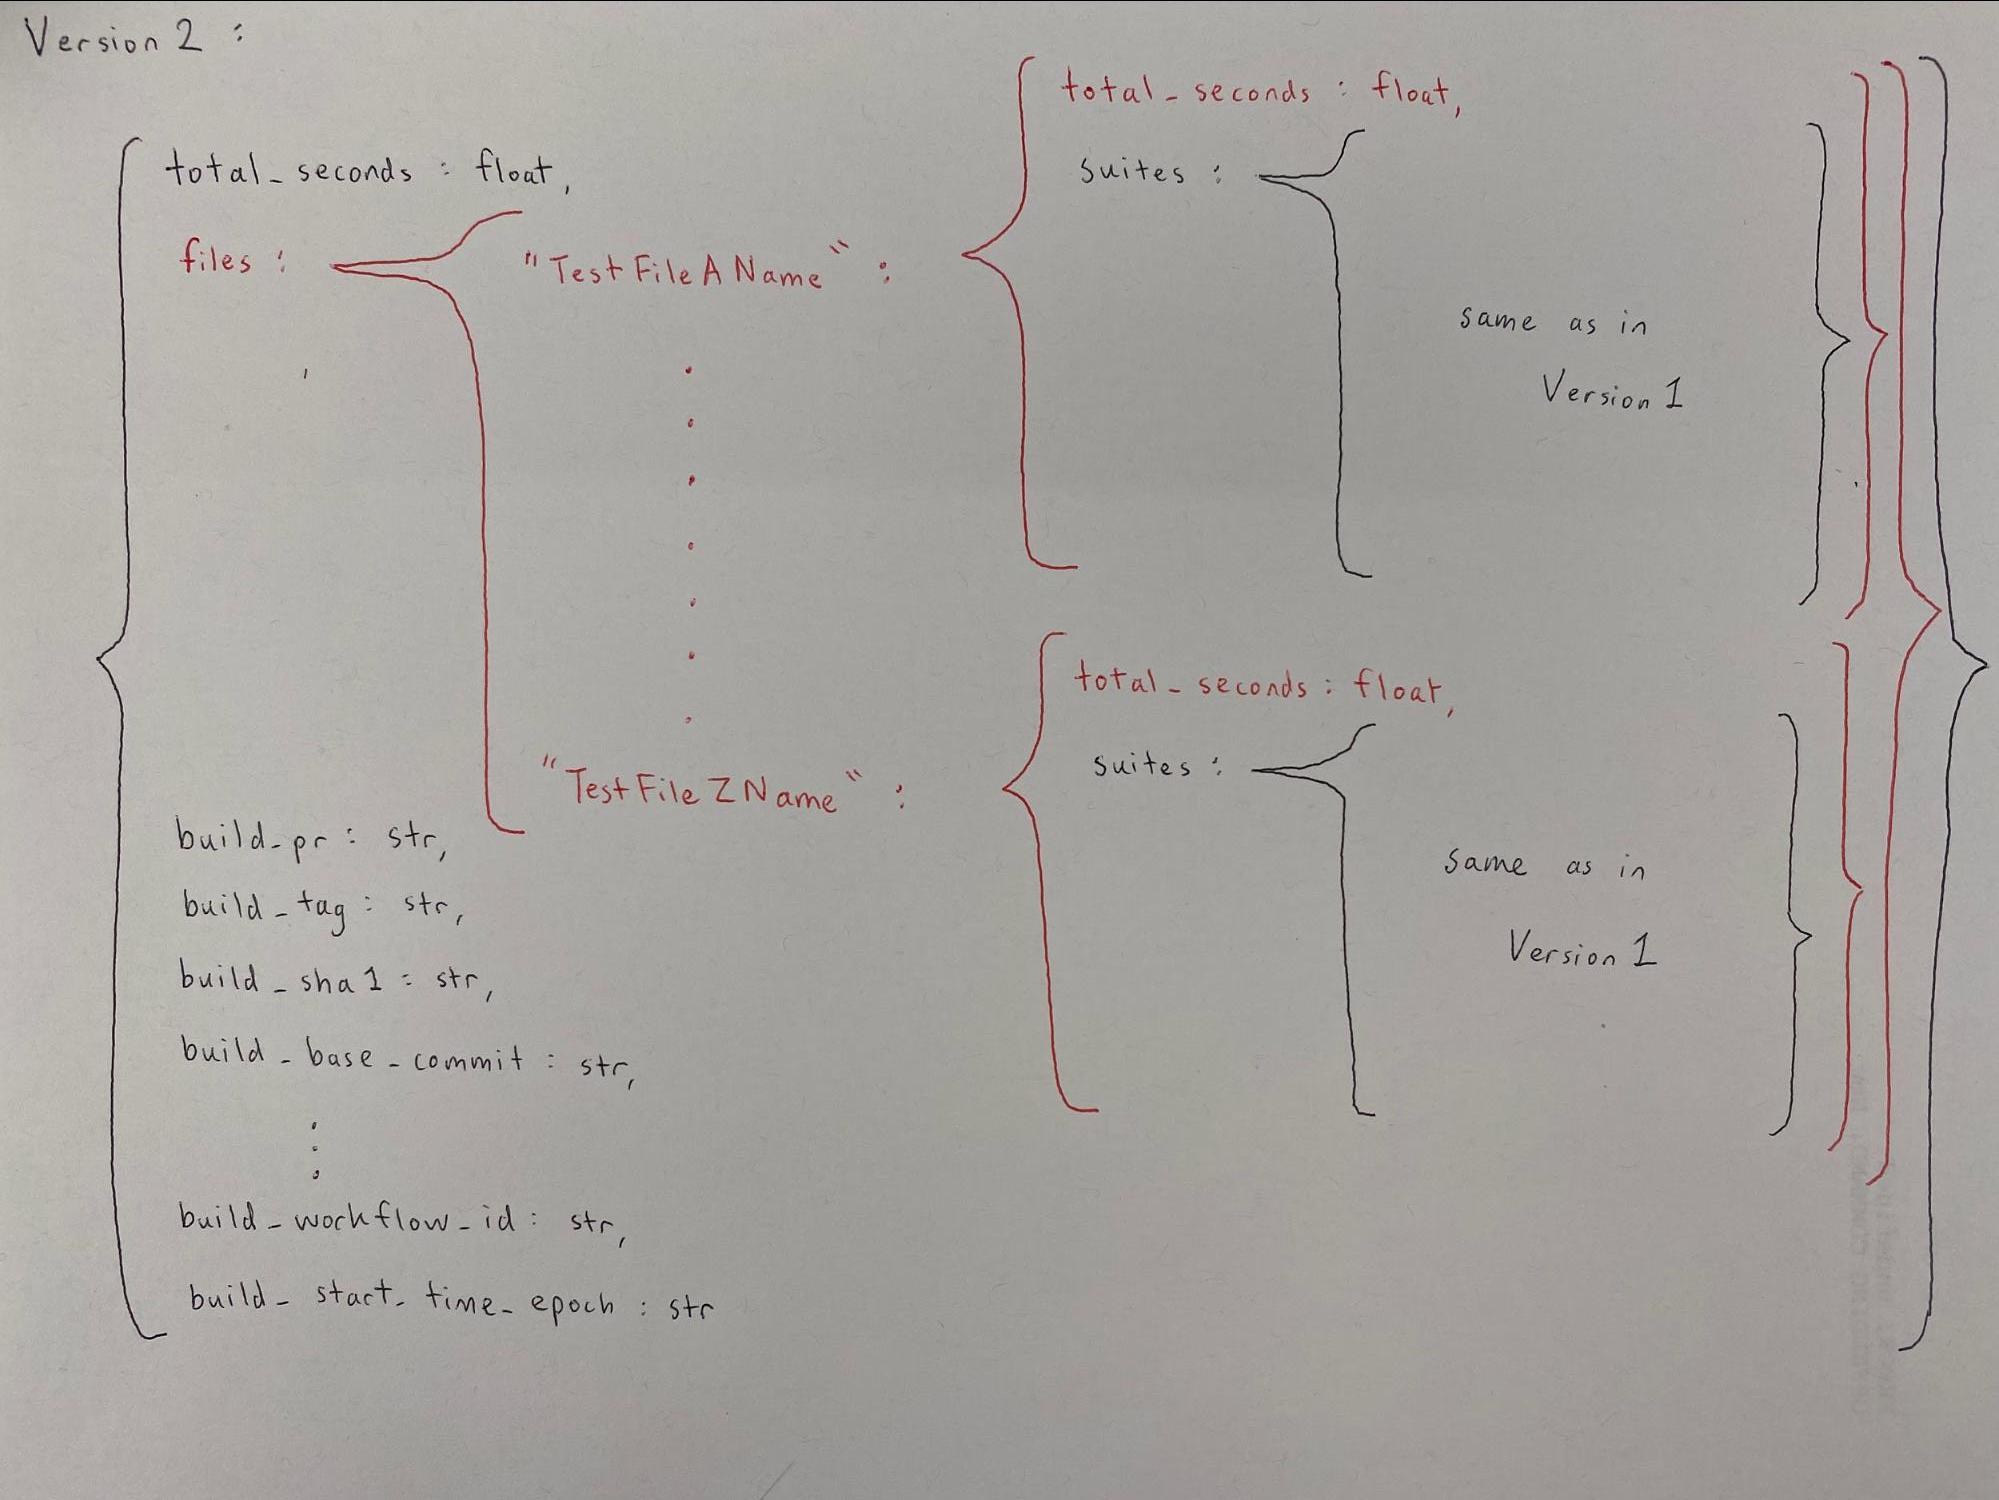
In fact, since sharding was a use case that only came up later in the layout of this data, we realized a few months after stats had already been piling up that we should have been tracking test filename information. We rewrote our entire JSON logic to accommodate sharding by test file–if you want to see how messy that was, check out the class definitions in this file.


I lightly chuckle today that this code has supported us the past 2 years and is still supporting our current sharding infrastructure. The chuckle is only light because even though this solution seems jank, it worked fine for the use cases we had in mind back then: sharding by file, categorizing slow tests, and a script to see test case history. It became a bigger problem when we started wanting more (surprise surprise). We wanted to try out Windows smoke tests (the same ones from the last section) and flaky test tracking, which both required more complex queries on test cases across different jobs on different commits from more than just the past day. The scalability problem now really hit us. Remember all the decompressing and de-aggregating and re-aggregating that was happening for every JSON? We would have had to do that massaging for potentially hundreds of thousands of JSONs. Hence, instead of going further down this path, we opted for a different solution that would allow easier querying–Amazon RDS.
Amazon RDS
TL;DR
- Pros: scale, publicly accessible, fast to query
- Con: higher maintenance costs
Amazon RDS was the natural publicly available database solution as we weren’t aware of Rockset at the time. To cover our growing requirements, we put in multiple weeks of effort to set up our RDS instance and created several AWS Lambdas to support the database, silently accepting the growing maintenance cost. With RDS, we were able to start hosting public dashboards of our metrics (like test redness and flakiness) on Grafana, which was a major win!
Life With Rockset
We probably would have continued with RDS for many years and eaten up the cost of operations as a necessity, but one of our engineers (Michael) decided to “go rogue” and test out Rockset near the end of 2021. The idea of “if it ain’t broke, don’t fix it,” was in the air, and most of us didn’t see immediate value in this endeavor. Michael insisted that minimizing maintenance cost was crucial especially for a small team of engineers, and he was right! It is usually easier to think of an additive solution, such as “let’s just build one more thing to alleviate this pain”, but it is usually better to go with a subtractive solution if available, such as “let’s just remove the pain!”
The results of this endeavor were quickly evident: Michael was able to set up Rockset and replicate the main components of our previous dashboard in under 2 weeks! Rockset met all of our requirements AND was less of a pain to maintain!

Whereas the first 3 requirements were consistently met by other data backend solutions, the “no-ops setup and maintenance” requirement was where Rockset won by a landslide. Aside from being a totally managed solution and meeting the requirements we were looking for in a data backend, using Rockset brought several other benefits.
-
Schemaless ingest
- We don’t have to schematize the data beforehand. Almost all our data is JSON and it’s very helpful to be able to write everything directly into Rockset and query the data as is.
- This has increased the velocity of development. We can add new features and data easily, without having to do extra work to make everything consistent.
-
Real-time data
- We ended up moving away from S3 as our data source and now use Rockset’s native connector to sync our CI stats from DynamoDB.
Rockset has proved to meet our requirements with its ability to scale, exist as an open and accessible cloud service, and query big datasets quickly. Uploading 10 million documents every hour is now the norm, and it comes without sacrificing querying capabilities. Our metrics and dashboards have been consolidated into one HUD with one backend, and we can now remove the unnecessary complexities of RDS with AWS Lambdas and self-hosted servers. We talked about Scuba (internal to Meta) earlier and we found that Rockset is very much like Scuba but hosted on the public cloud!
What Next?
We are excited to retire our old infrastructure and consolidate even more of our tools to use a common data backend. We are even more excited to find out what new tools we could build with Rockset.
This guest post was authored by Jane Xu and Michael Suo, who are both software engineers at Facebook.